


Newmont’s 26% three-month surge hides a sharper spending story that matters now. NYSE:NEM’s rally reflects gold hitting record levels and portfolio rotation into commodity-linked names. Short-term, momentum can amplify gains across US and Canadian-listed miners. Long-term, cuts to capex and production trends determine sustainable cash flow in North America, Latin America and Africa. For Europe and Asia, higher gold prices lift currency-hedged returns but tighten valuation gaps. Compared with the prior gold cycles, miners are showing lopsided gains on lower capex, not on higher output—an unusual combination for investors to parse.
Micro anomaly: Agnico Eagle’s multiples and the ROE tradeoff
NYSE:AEM’s valuation reads like a premium mining call. Market cap sits near $99.0 billion and trailing P/E registers about 28.8x, while forward P/E falls to roughly 19.4x. Return on equity stands at about 14.7% as of early January. Those three figures create a squeeze: investors are paying high present multiples but the company’s ROE hasn’t expanded to justify the premium yet.
In the short run, the high trailing P/E makes NYSE:AEM sensitive to gold price moves and short-term comps. Over the medium term, the forward P/E implies expected earnings growth; if free cash flow lags, the multiple compresses quickly. Trading volumes and analyst attention tend to rotate into names with clearer capex-to-output translation; AEM’s metrics suggest a bet on operational improvement rather than near-term production jumps.
- Market cap: ~$98.96B.
- Trailing P/E: ~28.84x; forward P/E: ~19.42x.
- ROE: ~14.67% (latest available).
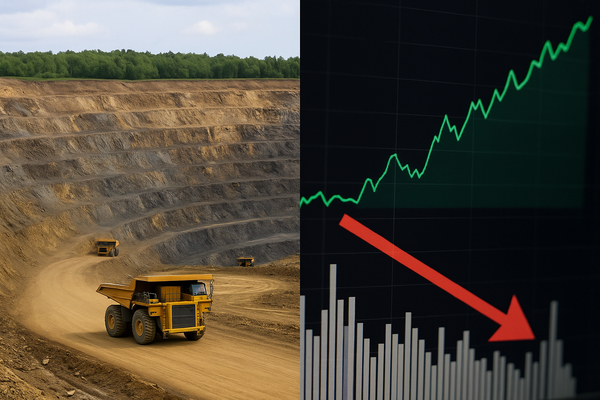
Newmont: a cash‑flow paradox behind the rally
NYSE:NEM climbed about 26% over three months as gold futures reached new highs. At the same time, Q3 data show capex fell roughly 17%, and reported free cash flow for that quarter topped $1.6 billion. The mix is paradoxical: stronger revenue drivers from the gold price but deliberate expenditure restraint on capital projects. Brokers still skew positive—average recommendations are around a Buy—but the bull case now depends on whether reduced capex sustains or simply front‑loads near-term FCF.
Quantified snapshot:
- Recent three-month price change: +26% (reported).
- Q3 free cash flow: $1.6 billion (record for the quarter).
- Q3 capex decline: ~17% year-over-year.
- Continuous gold futures (reported): ~$4,642.20/oz.
Short-term relevance is obvious: gold’s rally attracts flows to NYSE:NEM in the US and to gold funds in Europe and Asia. Long-term relevance hinges on whether lower capex persists without causing production declines. If output slips, rising gold prices may not fully offset lost ounces—so FCF today could be cheaper than FCF tomorrow.
Midpoint what‑if: if capex falls further—how far can FCF rise?
What if NYSE:NEM cut capex another 50% relative to the Q3 pace? Hypothetically, a halving of the Q3 capex run rate would free up cash flow equal to roughly half of the prior capex decline margin. That could push quarterly FCF materially above the reported $1.6 billion, at least transitorily. However, the tradeoff is lower future production and potential higher unit costs per ounce if development projects stall.
This scenario is not a forecast. It is a structural sensitivity check: one data point (17% capex cut) implies scope for additional FCF if management doubles down on austerity. Investors in the US, Europe and Asia should weigh immediate FCF boosts against a possible contraction in reserve replacement and long-term output forecasts.
Industrial signal: Linde’s soft patch and downstream demand
NYSE:LIN’s quarterly flow acts as a proxy for industrial demand that often bleeds into mining activity. Recent commentary flagged a Q4 drag; earlier-quarter sales were $8.6 billion in Q3, up 3% year-over-year and 1% sequentially. Those modest growth rates suggest incremental cooling in industrial cyclical demand—not collapse, but enough to affect oxygen and gas supply contracts that miners rely on for processing.
Key metrics cited around the period:
- Q3 sales: ~$8.6 billion (reported quarter).
- Year-over-year sales growth: ~+3%.
- Sequential sales change: ~+1%.
For mining names, weaker industrial demand in Europe and North America complicates the revenue story: higher metal or commodity prices can be offset by margin compression if service and energy inputs rise or if demand for byproducts softens. Additionally, filings and institutional buys—such as recent purchases by asset managers—signal differentiated positioning around perceived value or tax timing.
Market takeaways and the regional picture
Across these micro anomalies the macro picture matters now. US inflation prints and Fed expectations are central. The December CPI reading of about 2.6% pushed some rate-cut bets into midyear, helping non-yielding assets. Gold at roughly $4,642/oz benefits miners’ top lines in real terms, particularly for firms with low hedge ratios.
- US: rate-view sensitivity drives flows into NYSE-listed miners; FCF improvements tend to re-rate mid-cap miners faster.
- Europe: industrial demand weakness (as signaled by NYSE:LIN revenue growth) can blunt commodity-byproduct pricing.
- Asia & emerging markets: higher gold prices lift demand for safety assets, supporting miners’ shares but exposing valuation gaps.
Bottom line: the current setup is not a simple commodity play. NYSE:NEM’s 26% price surge and three-month momentum pair with a 17% capex pullback and record quarterly FCF—an unusual combination that forces investors to reconcile near-term cash generation with longer-term reserve economics. NYSE:AEM’s high multiples and middling ROE amplify the need for scrutiny at the company level. Meanwhile, NYSE:LIN’s industrial topline signals remind investors that downstream activity still feeds into miners’ cost and demand math across regions.
Note: This article is informational and not investment advice. All figures are cited from recent company reports and market releases.