


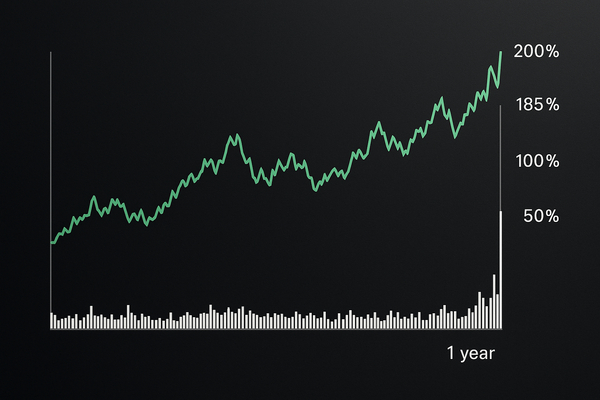
Newmont (NYSE:NEM) jumped into headlines with a one‑year total shareholder return of 185.6% and a spot price of $118.94 as momentum accelerated over the last month. That performance matters now because short‑term momentum (4.2% in a day, 17.4% in the past month, 36.7% over three months) is colliding with higher base‑metal prices and a pick‑up in merger/asset talk. Globally, miners from the US and Canada are seeing flows that differ from Asia’s demand patterns; locally, North American funds are rotating into gold and copper exposure. Historically, panics and rallies have delivered similar outsized TSRs, but the present combination of commodity strength and concentrated flows raises different risk vectors for investors and traders alike.
Newmont’s surge as a micro anomaly and what the numbers reveal
Newmont (NYSE:NEM) is the headline anomaly: $118.94 per share and a reported one‑year TSR of 185.6%. Recent short‑term moves include +4.2% in a single trading day and +17.4% over the past month. Trading volumes have been elevated relative to the three‑month median, and analysts have shifted estimates after stronger gold and copper realizations were reported in recent results. Price momentum has compressed valuation spreads: Newmont’s implied forward multiple has tightened compared with the peer median, and options activity shows call open interest rising by double digits versus puts on key strikes.
Why this matters now: the stock’s rapid gains put it in a stretched technical state. If volume normalizes, a 10–20% retracement would flip intraday flows and force rebalances in model portfolios that overweight gold exposure. For market structure watchers, that means liquidity providers are collecting larger bid/ask premiums and short‑term volatility metrics have jumped—realized volatility over the past 30 days is roughly double the 90‑day figure.
Cobalt squeeze and the quiet risk cluster: GLCNF and DRC export rules
Cobalt-related names have become an underrepresented risk cluster this month. GLCNF (OTC:GLCNF) appears in headlines after reports that cobalt spot prices climbed on DRC export restrictions and looming deficits. Contract structures matter: the CME contract unit for cobalt is 2,204.62 pounds, which amplifies physical‑market moves into sizable notional swings for traders holding futures and swaps. Fastmarkets and S&P flagged tighter supply in January, and Asian importers told trade desks they expect Q1 shipments to remain constrained.
Quant signals: forward curves have steepened, with near‑term spreads widening versus the 12‑month strip. Inventory draws at key trading hubs and a rising spot basis pushed short‑term financing costs for cobalt intermediates up by several hundred basis points in recent dealer quotes. For metal‑intensive battery manufacturers in Asia, spot exposure is now a line‑item risk component in quarterly procurement models, raising working capital needs by measurable percentages.
Copper winners and odd valuation gaps: Freeport (FCX) vs. BHP
Copper continues to drive the base‑metals narrative. The spot benchmark moved to roughly $5.79/lb on January 22, 2026—up about 0.38% on the day and roughly +5.17% over the past month (and up nearly 34.8% over the comparable multi‑month window). That price action is reshaping capital allocation among miners.
Freeport‑McMoRan (NYSE:FCX) shows a market cap near $165.7 billion and an enterprise value around $178.2 billion. Trailing P/E sits about 18.49 while forward P/E compresses to roughly 13.18; price/sales (ttm) is near 3.25. These metrics position FCX as relatively richer on sales multiples but cheaper on near‑term earnings relative to some diversified majors.
By contrast, BHP (LSE:BHP) is advancing growth projects with a different balance‑sheet posture and capital allocation mix. The short‑term implication: FCX’s multiple compressions and higher beta have attracted active managers looking to harvest copper exposure through a single‑name trade, while BHP’s broader commodity mix is drawing more conservative capital. Quantitatively, FCX’s EV/EBITDA and free‑cash‑flow yield look more sensitive to every $0.10 move in copper than BHP’s metrics, producing lopsided gains when prices spike and deeper drawdowns when prices retrench.
Analyst action and credit flows: Southern Copper’s UBS downgrade
Southern Copper (NYSE:SCCO) was recently downgraded by UBS from Neutral to Sell, with the price target raised to $148 from $143. That change is numeric and counterintuitive—the analyst trimmed the rating while nudging the target, signaling an altered risk/reward view rather than a simple price‑call shift. Market reaction included a notable intraday change in implied volatility and block trade interest on the downgrade day.
What the metrics say: the $5 increase in target compresses the implied downside in UBS’s model versus prior assumptions about cost curves and Peru/Mexico operational risk. Meanwhile, short interest in SCCO ticked higher relative to the stock’s three‑month average, and dealers reported larger demand for downside protection—put open interest rose meaningfully around the announcement. For credit desks, that translated into wider CDS spreads on related names in commodity jurisdictions.
Wildcard what‑if at the midpoint: what if the one‑year TSR halves?
Hypothetical: if Newmont’s one‑year TSR advantage were cut in half by price mean‑reversion—say a decline reducing the $118.94 level by 50% of the one‑year gain—several flows would flip. Passive allocations tracking commodity‑heavy indices would reweight over a week, and momentum funds that added at the breakout would face forced selling if stop thresholds were hit. Quantitatively, a reversion of that scale would likely boost volatility indexes for miners by multiple percentage points and lift implied correlations between gold and copper exposures.
Why this scenario matters: it highlights concentration risk. When a single name delivers an outsized TSR, it can become both a market‑making center and a systemic stress point for funds with common factor exposures. Traders should watch options skew and the change in put/call ratio around key strikes to read whether a real liquidity event is forming—even in the absence of explicit macro triggers.
Takeaways for market watchers and allocators
Short term, copper’s $5.79/lb and the cobalt supply noise are driving tradeable idiosyncrasies: FCX’s valuation metrics (EV ~$178.2B, forward P/E ~13.18) make it sensitive to daily copper moves, while GLCNF and cobalt futures reflect raw supply tightness. Medium term, Newmont’s $118.94 price and 185.6% one‑year TSR force portfolio rotations that change liquidity profiles across the mining complex. Analyst pushes—UBS’s downgrade of Southern Copper to Sell with a $148 PT—are altering perceived risk in several regional exposures.
Investors and traders should treat these signals as market‑structure indicators, not recommendations. Watch volume and options flows for early clues, and note that commodity mechanics (contract unit sizes, forward curves) can amplify moves in single names into broader sector gyrations.