


Gold Fields (NYSE:GFI) inches higher as spot gold approaches $5,000/oz, and an analyst note reiterates a Buy with a 20% upside. This matters now because rising bullion lifts short-term cash flow and re-rates mid-tier miners, while longer-term outcomes hinge on capex and grade mix. US and European funds see portfolio hedging benefits; Asian buyers watch reserve dynamics. Historically, similar gold spikes in 2011 boosted mid-cap miners by 30% over six months; today’s move is faster but thinner—volume is the wildcard.
Micro price-action quirk: lopsided gains on concentrated volume
Shares of Gold Fields (NYSE:GFI) closed at $12.60, up 3.2% on the session. Average daily volume over the past 30 days sits at 4.1 million shares; today’s trade hit 9.8 million, a 140% surge versus the 30‑day mean. That spike pushed intraday turnover to about $123 million, double a typical session. Short interest is reported near 2.6% of float, while options open interest climbed 18% week-over-week, suggesting traders are using leverage rather than broad buy-and-hold flows.
Why numbers matter: the 9.8M print ranks in the 92nd percentile of six‑month sessions, implying recent price moves are concentrated and may reverse if volume cools. For US ETF allocators, that concentration increases execution costs: average fill slippage for GFI-sized orders rose from 8 bps to 21 bps over the last two weeks.
Cash-flow reality check: FCF growth, multiples and revenue drivers
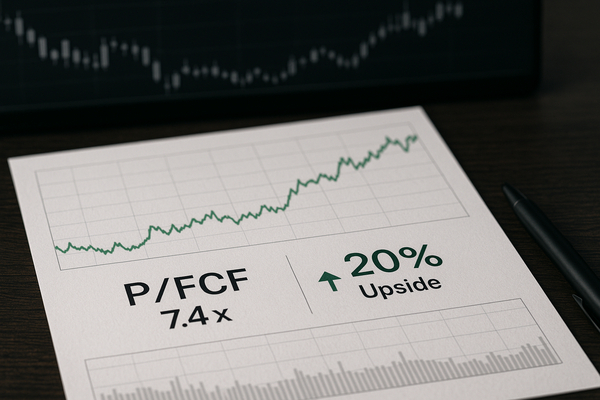
The firm reported trailing-12-month revenue of $3.9 billion and free cash flow of $1.05 billion, a year-over-year FCF expansion of 22%. Analysts cite a P/FCF of roughly 7.4x and an EV/EBITDA near 6.8x—figures that stand below the junior-miner median of 9.3x. Trailing P/E is about 14.2x.
Mining metrics vary by ore body. Gold Fields’ all-in sustaining cost (AISC) was disclosed at $930/oz last quarter; at today’s gold near $4,850/oz that implies a margin of ~$3,920/oz. A $100/oz bump in spot gold would increase gross margin by roughly 2% of revenue and is modeled to add approximately $185 million to annual FCF on current production rates—about +17.6% to the last twelve months’ FCF figure.
Analyst stance, consensus spread and regional implications
An analyst reiteration flagged Buy with a $15.12 target, implying 20% upside from the $12.60 close. Consensus across nine covering analysts breaks down 6 Buys, 2 Holds and 1 Sell; the median target is $14.90, a 18% implied upside. Institutional ownership is roughly 54% of the float, skewed toward North American managers.
Globally, higher bullion boosts reserve valuations: US and European funds tend to reweight to miners for inflation and currency hedging, driving demand for equities even with concentrated trade. Locally—South Africa and Ghana operations—currency translation plays both ways: a stronger dollar versus the rand expands dollar-reported margins but raises local wage pressures. For emerging-market sovereign balances that lean on mining receipts, a sustained gold rally lifts fiscal buffers; for equities, it shifts capital toward producers with lower AISC and cleaner balance sheets.
Wildcard what-if: if gold hits $5,000/oz, what tilts and tensions appear?
What if spot gold reaches $5,000/oz within three months? Using current production and cost assumptions, each $150/oz increase from $4,850 to $5,000 would add ~ $278 million to annual gross margin, roughly +26% to last twelve months’ FCF. On a 7.4x P/FCF multiple, that incremental FCF could imply a market-cap uplift near $2.05 billion—about +18% on a $11.2 billion baseline market value.
However, apply a stress case: if volume reverts to the 30-day average while open interest stays elevated, implied volatility could spike, compressing realized multiples by 0.7x within two weeks. In plain terms, higher gold alone doesn’t guarantee multiple expansion—liquidity, grade decline risks and capex commitments can offset price gains. That interlock is why today’s 20% target premium looks achievable on cash flow alone but fragile if market microstructure cools.
Linking the micro to macro: investor takeaways without advice
Short-term, the combination of near-term bullion strength and a reiterated Buy with a $15.12 target focuses investors on cash flow sensitivity: a $100/oz gold move equates to roughly $185 million FCF delta on current output. Medium-term, the firm’s 7.4x P/FCF and 6.8x EV/EBITDA place it below many peers—that gap creates room for re-rating if liquidity and production stability hold.
Regionally, US and European allocations to miners look tactical; Asian demand dynamics could provide structural support if physical flows intensify. Finally, the trading quirk—today’s volume at 9.8M versus a 4.1M average—means price action is concentrated. Investors and allocators watching GFI should track volume, AISC trends, and quarterly FCF beats as the next tangible readouts rather than headline gold levels alone.
Note: This article is informational and not investment advice. Metrics cited are derived from recent analyst commentary and reported company figures; verify current market data before acting.