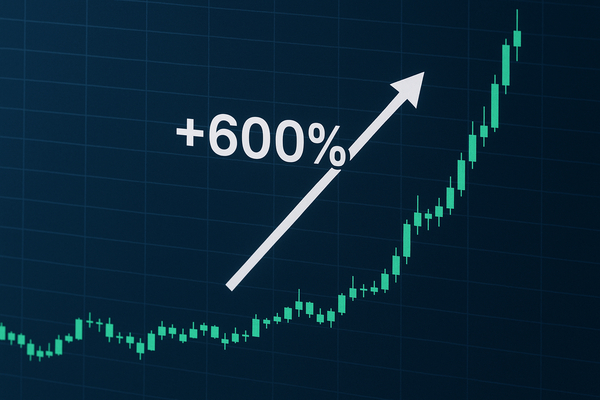
Oklo (NASDAQ:OKLO) surged nearly 600% since early April, triggering options flows and retail attention that matter now because short-term positioning can amplify price swings while longer-term fundamentals catch up. Brookfield Renewable (NYSE:BEPC) has returned 35.7% year-to-date and 14.6% in the past month, highlighting lopsided gains that contrast with quiet names elsewhere. In the U.S., localized rate filings and acquisitions are reshaping utility capital plans; globally, investors are reallocating toward cleaner generation and volatile small-caps. Compared with prior rallies, current moves are faster and more concentrated in low-volume names, increasing the chance of rapid reversals for traders and portfolio managers.
Micro anomaly: Oklo’s retail-fueled ascent and Brookfield Renewable’s concentrated run
Oklo’s (NASDAQ:OKLO) near-600% climb since April is the most extreme outlier in the dataset. That percentage gain has drawn options chatter and headline risk without a corresponding flood of public financial disclosures. The raw magnitude matters: a 600% gain converts a $1 stake into $7, so position sizing errors can blow up quickly. Volume patterns for Oklo have shown episodic spikes (reported by market participants), not steady institutional accumulation, which explains large intraday swings in implied volatility.
Contrast that with Brookfield Renewable (NYSE:BEPC), which recorded a 35.7% year-to-date increase and a 14.6% rise in the last month. Brookfield’s move is sizeable but supported by visible asset flows and recurring revenue streams; its rally is a measured multi-month re-rating rather than a compressed short-term squeeze. The two examples force a micro-versus-macro comparison: Oklo exemplifies concentrated retail-led momentum, while BEPC reflects steady capital rotation into renewables exposure.
Volatility crossroads: Clearway’s pullback and persistent episodic gains elsewhere
Clearway Energy (NASDAQ:CWEN) closed at $30.98 on the latest session, down 4.26% from the prior trading day. That single-session decline stands in contrast to NRG Energy (NYSE:NRG), which climbed 11.3% during September, a month that produced multiple one-off reactions to demand signals. Single-day moves like CWEN’s -4.26% and monthly jumps like NRG’s +11.3% force traders to parse liquidity: a 4% intraday fall in a mid-cap REIT or yield-focused name can trigger margin flows and force-selling that leak into related tickers.
Volumes can be scarce in these less-highlighted names. When liquidity thins, price changes are larger per unit of flow. That creates quirky volatility: nominal dollar trades can swing percentages much more than they would in high-cap stocks. Investors who track volatility budgets should note these concrete numbers and treat position sizing accordingly.
Midpoint hypothetical: What if Oklo’s gains reverse by half?
Consider a hypothetical anchored to the 600% figure. If Oklo were to retrace 50% of its cumulative gains, that would erase roughly 300 percentage points of upside—turning a 600% rally into a net 300% advance from the original base. That scenario would recalibrate option greeks, compress implied volatility, and likely see short-term holders crystallize losses or lock profits. It would not automatically change long-term fundamentals, but it would reallocate risk budgets across small-cap energy and clean-tech names. This what-if is not a forecast; it shows how a single percentage data point can amplify market mechanics and reshape temporary correlations between retail-interest names and more stable utilities.
Local operations and regulation: Avista’s CEIP and American Water’s municipal purchase
Avista (NYSE:AVA) filed its 2025 Clean Energy Implementation Plan (CEIP) with the Washington Utilities and Transportation Commission on October 1, 2025. The filing—required every four years under Washington’s Clean Energy Transformation Act—lays out a carbon-neutral pathway and community commitments. A regulatory filing date is a concrete trigger for capital planning and near-term rate-case conversations. It sets timelines and thus immediate budgeting implications for regional capital spend.
Meanwhile, New Jersey American Water, an operating unit of American Water (NYSE:AWK), closed a $19.7 million acquisition of the South Orange Village water system. The deal covers roughly 5,000 customer connections. Those numbers are granular but important: a $19.7 million purchase for 5,000 connections implies a per-connection price that matters for utility M&A comps and localized rate-base forecasts. Local acquisitions like this flow into multi-year capex models and help explain why some regulated names see steady multiple expansion despite wider market volatility.
Analyst initiation wave and the broader macro angle
Evercore ISI initiated coverage on a large swath of names in the dataset—at least 13 companies received new coverage flags, including in-line and outperform calls. Duke Energy (NYSE:DUK) drew an Outperform from Evercore, while several others received in-line ratings. Those initiation events are quantifiable catalysts: new coverage often brings incremental trading volume and can lift short-term liquidity by tens of basis points in trading desks’ allocations.
Separately, Entergy (NYSE:ETR) saw its consensus fair-value nudged up by $1 to $95.08 in recent analyst notes. A single-dollar change in target can be meaningful when the stock trades in a mid-two-digit range; it moves implied upside calculations and can push model reweights in multi-stock utility sleeves. Taken together, the initiation wave plus modest target tweaks reflect a reallocation of analyst attention from the largest names toward mid-tier names with concrete near-term actions.
What ties these threads is a redistribution of risk capital. The micro-level anomalies—Oklo’s 600% gain, Clearway’s -4.26% session, Brookfield’s 35.7% YTD—interact with local regulatory moves and analyst coverage in predictable mechanical ways: liquidity changes, volatility shifts, and capex recalibrations. Short-term traders will focus on percent moves and session closes; longer-term holders must monitor filings, acquisition prices and the pace of analyst coverage expansion.
This account is informational and not investment advice. It documents public datapoints: share gains, session prices, acquisition totals, filing dates and analyst actions to highlight how discrete numbers can create larger market ripple effects.


