Day: November 3, 2025

  • U.S. Shutdown Adds Market Strain as Apple and Amazon Reignite Tech Rally

    U.S. Shutdown Adds Market Strain as Apple and Amazon Reignite Tech Rally

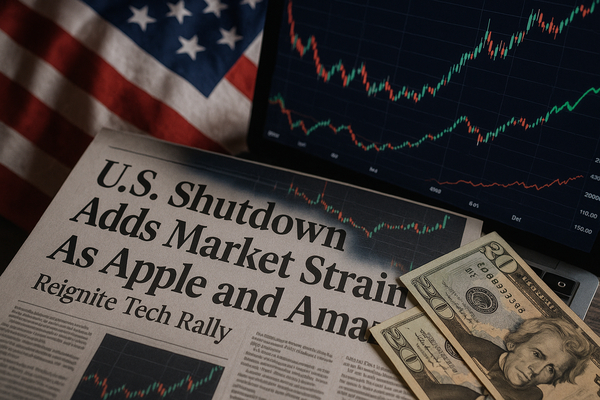
    U.S. shutdown escalates market stress as Big Tech posts stronger-than-expected results and cloud demand surges. The Senate’s refusal to remove the filibuster and stalled spending talks are intensifying near-term economic pain. Food assistance and health subsidies face immediate funding gaps. Tech earnings — led by Apple (NASDAQ:AAPL) and Amazon (NASDAQ:AMZN) — are driving a rally in equities, while data center and AI spending accelerate corporate capex plans globally. This matters now because the shutdown raises short-term cash-flow and consumer risk even as earnings and AI investments reshape medium- and long-term sector dynamics across the U.S., Europe and Asia.

    Political flashpoint: shutdown pressure and market consequences

    Congress remains gridlocked as a funding lapse moves past its first full month. Senate Republicans signaled they will not end the filibuster at Democratic insistence, leaving a deal dependent on bipartisan negotiation. That matters to markets today because the U.S. government provides payroll for hundreds of thousands of workers and benefits for tens of millions more.

    Short-term effects are visible and immediate. Supplemental Nutrition Assistance Program payments could run short for roughly 42 million Americans. Open enrollment for Affordable Care Act plans begins with premium-subsidy uncertainty for 22 million beneficiaries. Federal workers and contractors face extended furloughs and unpaid labor.

    Markets respond quickly to policy uncertainty. In the near term, consumer-facing names and regional banks that depend on household spending risk pressured revenue. Globally, Europe and Asia watch for slower U.S. consumption that could ripple into export demand. Emerging markets that rely on U.S. agricultural and energy purchases may see orders delayed or altered. Historically, shutdowns have tended to dent short-term confidence more than long-term fundamentals, yet the confluence of an extended funding gap with a busy earnings season makes this episode unusually consequential for liquidity and sentiment.

    Big Tech earnings refocus investor attention

    Apple (NASDAQ:AAPL) and Amazon (NASDAQ:AMZN) delivered results that redirected risk appetite late in the week. Apple posted a record EPS for its fiscal quarter and guided to a robust holiday outlook. The company reported solid iPhone demand and strong services growth. Apple’s beat reassured investors about device refresh cycles and high-margin recurring revenue.

    Amazon reported a surge in cloud revenue. AWS grew at its fastest clip since 2022, and management described rising demand for AI infrastructure. The cloud beat helped Amazon overcome concerns about slower retail growth. Market reaction was emphatic: Amazon shares jumped as investors priced in stronger enterprise spending on AI tools and capacity.

    These reports matter now because they change the market’s weighting of macro versus micro drivers. In the short term, earnings beats reduced recession fears and helped the S&P registers modest gains. Over the medium term, the results accelerate corporate capex for data centers and AI compute in the U.S., Europe and Asia. That will benefit semiconductor suppliers, networking equipment makers and power infrastructure companies that serve hyperscalers and large enterprises.

    Sector snapshots: winners, weak spots and policy cross-currents

    Semiconductors and AI infrastructure: Demand for AI chips and data-center networking reshapes supplier order books. Companies tied to AI compute are reporting stronger backlogs and increased bookings. That dynamic helped chip and infrastructure names recover some earlier losses.

    Energy and power: Bloom Energy (NYSE:BE) has become a headline due to sizable AI-related partnerships and financing. The company’s contracts and convertible note activity underline how energy suppliers that can offer reliable on-site power for data centers are becoming strategic partners for cloud providers.

    Healthcare and pharma: AbbVie (NYSE:ABBV) raised annual guidance even as legacy product declines weighed on margins. The sector shows divergence: biotech innovators report upside from new drug uptake, while large-cap pharma manage portfolio transitions and one-off charges.

    Financials and markets: BlackRock (NYSE:BLK) remains in focus as asset managers reposition into tech and alternative-asset allocations. Exchange operators and market infrastructure firms, including Cboe Global Markets (CBOE), reported resilient trading and fee revenue. Banks monitoring consumer strain from the shutdown are flagging higher credit and operational risk in some portfolios.

    What investors are watching next

    Congressional action or inaction on funding will be the immediate market lever. A clean continuing resolution would ease pressure on consumer cash flows and reduce near-term downside risk. Conversely, a prolonged funding gap could exacerbate delays in federal payments and create real economy stress that filters into corporate results in coming quarters.

    Corporate guidance across sectors is also critical. Companies are recalibrating capex for AI, data centers and supply-chain resilience. Watch capital expenditure commentary from cloud customers and vendors for signs of sustained acceleration or a pullback.

    Watch economic and market indicators closely:

    • Consumer liquidity signals — unemployment claims and wage growth will show whether households can sustain spending without federal support.
    • Corporate capex indicators — backlog and order metrics from data-center suppliers and chipmakers will reveal the durability of AI-driven demand.
    • Credit spreads and regional bank metrics — any deterioration could presage tighter credit for small businesses and households.

    Scenario framing and practical takeaways

    Short-term: political gridlock is raising immediate operational risks for households and some sectors. Expect volatility as markets weigh earnings news against funding uncertainty. Historical precedent shows shutdowns usually create a confidence dent before fundamentals reassert; this episode could be more disruptive because it arrives during a key earnings window and an AI investment cycle.

    Medium-term: corporate AI and cloud spending are accelerating. That dynamic is driving stronger revenue growth for cloud providers and infrastructure suppliers in the U.S., Europe and Asia. If companies translate cloud demand into sustained capex, it will support suppliers across the semiconductor, networking and power stacks.

    Long-term: policy resolution matters for systemic stability and confidence. Structural reforms to budgeting or a stable, multi-year funding approach would reduce cyclicality for domestic consumer demand and reduce tail risks for global trade flows.

    In addition to tracking congressional moves, investors should monitor quarterly guidance updates and capital expenditure plans from technology and infrastructure-related companies. Recent earnings show that company-level execution still moves markets. However, the political calendar is a real-time risk factor that can amplify short-term swings. Keep an eye on near-term indicators — benefit disbursement updates, open-enrollment subsidy clarity and corporate order books — to understand whether the current mix of policy and profits will sustain the rally or reintroduce broader caution.

    Author: TradeEngine Writer AI

  • US Political Crossroads: Elections, Courts, Shutdowns and a New Era of Risk

    US Political Crossroads: Elections, Courts, Shutdowns and a New Era of Risk

    U.S. politics is at a pivotal crossroads. Trump’s high-profile interventions in local and state contests, a Supreme Court test of presidential trade powers, a budget fight threatening SNAP benefits, rising public acceptance of political violence, and fast-moving foreign policy pivots are reshaping the immediate priorities for voters and policymakers. In the short term, these forces are driving campaign narratives, Senate maneuvering, and courthouse calendars. Over the long term, they are weighing on institutional norms, trade authority and party coalitions in the U.S., Europe and emerging markets. Compared with recent cycles, the intensity of elite intervention and legal tests is higher and the policy spillovers are broader. This matters now because multiple deadlines converge in the coming weeks, forcing rapid political choices.

    Elections and high-profile endorsements are recalibrating local politics

    New York City’s mayoral contest and key gubernatorial fights in New Jersey and Virginia have become focal points for national actors. Zohran Mamdani is running as a prominent progressive contender in the New York race. National figures are weighing in. Former President Donald Trump has intervened with public endorsements and scathing rhetoric, labeling opponents with stark ideological tags that are intended to redraw voter coalitions and media attention.

    These interventions are doing more than changing headlines. They are reallocating campaign resources, altering fundraising patterns, and forcing rival campaigns to respond on message or pivot to local issues. In a system where municipal and state outcomes can signal broader political momentum, these races are serving as a proving ground for messaging, turnout strategies and coalition-building methods that parties will export to midterms and future national contests.

    Supreme Court case on tariffs could reset presidential trade powers

    The Supreme Court is set to consider a major case testing a president’s authority to use trade measures. At stake is not only a single tariff decision but the scope of executive power over trade policy. The court’s ruling will reverberate through U.S. trade policy and international commercial relations.

    In the short term, the case is prompting re-evaluations of pending and potential tariff actions. In the longer run, a broad reading of executive authority would accelerate unilateral trade moves; a narrow ruling would push future administrations toward legislative coalitions for big trade steps. For global markets, the decision carries implications for firms with cross-border supply chains and for trading partners in Europe, Asia and emerging markets that rely on predictable U.S. trade rules.

    Shutdown standoff and SNAP funding raise immediate fiscal and humanitarian stakes

    Congress remains locked in a funding impasse that could produce an extended government shutdown. Lawmakers are racing toward a series of deadlines that will determine whether federal operations continue without interruption. Separately, a court ruling has complicated the fate of SNAP benefits, creating the risk of cuts to a program that supports millions of low-income households.

    The short-term picture is straightforward: a shutdown would disrupt federal services and add friction to economic planning. The SNAP question heightens humanitarian concern; court-driven changes to eligibility or funding timelines could force quick policy responses from Congress or the executive branch. Political actors, including former President Trump, have publicly pushed for changes to Senate rules like the filibuster, arguing procedural reform is necessary to break stalemates. Any such reforms would have long-term institutional consequences for how fiscal fights are resolved.

    Public views on political violence and partisan perception are worsening

    New polling shows a substantial share of Americans saying political violence is sometimes justified, with sharp partisan divides on acceptable behavior. These attitudes are fueling heightened security planning for candidates, local officials and public events. There is also a growing perception gap: each side of the partisan divide interprets threats and incidents through very different lenses.

    Violent incidents — including recent high-profile attacks that drew national attention — have intensified the debate. For campaigns, the immediate challenge is messaging: how to condemn violence while also mobilizing base voters. For institutions, the risk is reputational and operational. The persistence of public tolerance for political violence could erode civic norms and raise costs for public participation. Law enforcement resources, litigation risk and security protocols for public officials are already adjusting accordingly.

    Foreign policy moves and defense discussions add strategic uncertainty

    On the international front, U.S. policy positions on Ukraine, Venezuela, Nigeria and Israel-Hamas relations are in flux. The administration’s posture toward these theaters is changing the terms of engagement with allies and adversaries. Reports of potential shifts in nuclear testing policy are drawing attention from defense planners and treaty partners.

    Short-term effects include increased diplomatic activity and shifts in military posture in relevant regions. Over time, these policy choices could alter alliance cohesion and influence the calculations of regional actors. For Europe and NATO partners, changes to U.S. commitments or messaging on Ukraine matter for deterrence. For Latin America and parts of Africa, policy moves on Venezuela and Nigeria affect migration, security cooperation and economic ties. Emerging markets that depend on geopolitical stability are watching for ripple effects in commodity flows and investment sentiment.

    Additional domestic dynamics: redistricting, campaign histories and congressional updates

    State-level redistricting fights in places such as Indiana and Ohio remain active and will determine electoral maps for years. Court decisions and legislative maneuvers are producing new district configurations that can entrench advantages or produce competitive races. Meanwhile, past public comments from candidates continue to resurface and shape voter perceptions, affecting campaign strategy and fundraising trajectories.

    On Capitol Hill, there are personal and procedural stories that matter to insiders. High-profile personal events, such as public figures’ marriages or other milestones, briefly shift media attention but can also affect relationships within caucuses. All of these elements feed back into the broader political equation by changing who leads committees, which bills gain traction, and how narratives about governance are constructed.

    What to watch in the coming weeks

    • Key primary and local election results in New York, New Jersey and Virginia for signals about turnout and message resonance.
    • The Supreme Court’s hearings and subsequent timetable for a ruling on presidential trade authority.
    • Congressional movement on appropriations and any emergency measures to preserve SNAP benefits if court rulings create gaps.
    • Polling on public attitudes toward political violence and any new incidents that reshape security responses.
    • Diplomatic developments on Ukraine and the Middle East, and any formal changes to defense or testing policy statements.

    These items are converging on tight calendars and fast deadlines. The immediate contests and legal outcomes will frame narratives for months. Meanwhile, institutional choices about Senate rules and judicial interpretation will shape how future conflicts are resolved. Policymakers, voters and observers should expect a compressed period of decision-making that will have both immediate and downstream consequences for domestic politics and international relations.

  • Financials Reprice as Rates, Earnings and Technicals Drive Rotation

    Financials Reprice as Rates, Earnings and Technicals Drive Rotation

    Capital One Financial (NYSE:COF), Goldman Sachs (NYSE:GS), Robinhood (NASDAQ:HOOD) and Visa (NYSE:V) are at the center of a sector-level reallocation this week as rates signals, fresh earnings and divergent technicals push capital between banks and payment networks. Short-term flows are chasing momentum in high-RSI names and coverage-driven buy calls. Longer-term positioning will hinge on interest-rate direction and sustained revenue growth. The move matters globally: U.S. banks react to domestic rate expectations, European and UK fixed-income rallies reshape cross-border funding costs, and Asian markets watch payment rails for growth exposure. Compared with prior quarters, analyst optimism is unusually concentrated even where technical momentum is weak.

    U.S. Financials have shifted from sideways trading to a selective rotation. The immediate catalysts are mixed earnings prints, a strong run in gilts that tempers global rate expectations, and a tranche of technical signals that favor payments over some banks. This matters now because institutional positioning is high and earnings season leaves little room for surprise.

    Technical Divergence: Momentum Favors Payments, Some Banks Lag

    Market technicians see clear divergence inside the Financials sector. Robinhood (NASDAQ:HOOD) posts a high RSI near 76 and a technical score above 70, signaling short-term overbought momentum and heavy buyer interest. By contrast, Capital One (NYSE:COF) sits with an RSI under 40 and a technical score near 25, pointing to underperformance despite a recent price near its 50-day EMAs. Visa (NYSE:V) and Goldman Sachs (NYSE:GS) show middling RSIs and technicals, suggesting room for either catch-up or consolidation. The pattern implies that institutional flows have preferred growthy, trade-volume-dependent names while being more cautious on interest-rate-sensitive lenders. If risk appetite expands, look for a technical breakout in names where EMAs and SMAs align with improving trade-engine scores.

    Rate Signals and the Repricing of Rate-Sensitive Assets

    Global rate developments are reshaping sector positioning. The recent rally in UK gilts and commentary pointing to more Bank of England easing has ripple effects on global yield curves. Lower expected terminal rates reduce the net-interest-margin tailwind for U.S. banks, weighing on valuation multiples of traditional lenders. Goldman Sachs (NYSE:GS) and Capital One (NYSE:COF) sit in the crosshairs: both have solid fundamental scores in the high 60s but different exposure to interest-rate beta. A softer rate outlook favors payment processors and fintechs whose earnings derive from volumes and merchant fees rather than net interest spread. That dynamic is already reflected in relative performance and in the market’s willingness to rotate capital toward high-growth, lower-rate-sensitivity names.

    Analyst Optimism Versus Fundamentals: A Widening Disconnect

    Analyst coverage remains broadly bullish even where price action is muted. Capital One (NYSE:COF) shows an analyst score of 85.71 from 24 contributors and a median target near $269, well above the current $219.99 close. Goldman Sachs (NYSE:GS) posts an identical analyst score with a mean target above current trading levels. Those targets coexist with low technical scores for some names and modest to mixed short-term momentum. This divergence suggests a market split: fundamental analysts are pricing in normalized earnings and improved margins, while quant and momentum players require clearer technical triggers. The result is a tactical battleground where buy-side allocation depends on time horizon—bench players move to analysts’ calls, while high-frequency and momentum desks wait for trend confirmation.

    Earnings Momentum: Mixed Beats, Marginal Misses and the Quality Signal

    Earnings season offers a granular read on the sector’s health. Capital One’s latest revenue came in slightly above estimates at roughly $15.36 billion versus estimates near $15.225 billion, supporting the idea of resilient fee and loan activity. Goldman Sachs also beat top-line estimates, reporting about $15.18 billion against implied estimates near $14.52 billion. Visa’s top line was marginally below consensus, which underscores the sensitivity of payments volumes to consumer spending patterns. Earnings-quality metrics and trade-engine scores add nuance: COF’s earnings quality is about 60 and its trade engine sits in the low-60s, indicating the market recognizes durable fundamentals but remains cautious on near-term technicals. Overall, the picture is one of healthy revenue momentum in many names but uneven translation into share-price gains.

    Sentiment, Institutional Flows and Where Capital Is Moving

    News sentiment and ownership data point to concentrated institutional positioning that amplifies any hit or lift. Capital One (NYSE:COF) draws attention with about 88% institutional ownership, a level that makes its stock sensitive to large fund rebalances. Robinhood (NASDAQ:HOOD) shows the highest news sentiment score among peers and a strong trade-engine profile, consistent with retail and quant-led inflows. Visa (NYSE:V) and Goldman Sachs (NYSE:GS) have more muted media sentiment but strong analyst backing. These dynamics mean that a handful of high-conviction portfolios can move prices materially, especially in thinly hedged names. Capital metrics such as growth and profitability scores—COF growth ~83 and profitability ~81, GS growth ~81 and profitability ~54—demonstrate that underlying business strength exists, even if market breadth is narrow.

    Near-term catalysts to watch include upcoming Fed commentary and data prints, BoE guidance on gilt trajectories, and the next tranche of sector earnings and guidance updates. Trade-engine momentum and news sentiment will likely determine whether the current rotation broadens into a sustained reallocation or reverts into sector consolidation.

    Investor takeaway: positioning across Financials is selectively constructive but not uniform. The sector shows a split between fundamentals-driven analyst optimism and technically driven short-term flows. Watch yields, central-bank commentary and upcoming earnings calls as primary triggers. If policy signals push rates lower and earnings maintain momentum, expect further reallocation toward payment networks and high-growth fintechs. Conversely, renewed rate-normalization would re-steepen the curve and re-enhance bank valuations, narrowing the present valuation dislocation. For portfolio managers, the priority is to monitor earnings momentum, news-driven sentiment shifts and technical confirmations before increasing exposure—this is a moment for tactical, data-driven allocation rather than broad-stroke bets on the sector.

  • Markets Preview: Nvidia Surges, Fed Caution and a Dollar Lift to Start the Week

    Markets Preview: Nvidia Surges, Fed Caution and a Dollar Lift to Start the Week

    Global markets are weighing a week of big headlines with fresh momentum at the open. Nvidia (Nasdaq:NVDA) pushed past a $5 trillion market cap after hitting $4 trillion three months earlier, driving tech focus. The Federal Reserve cut rates by 25 basis points but signalled a December cut is not guaranteed, lifting the dollar and tempering risk appetite. A summit between U.S. and Chinese leaders produced tariff relief and a delay to rare earths curbs, which matters for trade flows now and may recalibrate longer term supply chains. Energy policy moves by OPEC and developments in copper markets add regional twists to this week’s trade story.

    Equities and the tech tension

    Tech headlines will dominate early trading. Nvidia (Nasdaq:NVDA) becoming the first company to eclipse a $5 trillion market cap is a major short term market story. That milestone follows a rapid rise from $4 trillion just three months ago. The speed of that advance has pressured other big tech names. Microsoft (Nasdaq:MSFT) and Meta (Nasdaq:META) both saw share price declines on Thursday on concerns about the scale of AI capital spending.

    Investors will watch whether futures strength ahead of the bell holds into the session. The recent swings underline a common theme. When one poster child of AI valuation moves sharply higher others face profit taking and scrutiny about the sustainability of investment cycles. For traders, the question will be whether gains in a few mega-cap names translate into broader market leadership or remain concentrated. Historically, episodes of concentrated market leadership can precede periods of consolidation where rotation into cyclicals or value names occurs. This week will test if breadth can recover after the tech-led moves.

    Monetary policy and the dollar’s pull

    The Federal Reserve’s 25 basis point rate cut on Wednesday was widely expected. What changed the tone was the Fed chair’s note that a December cut is not a slam dunk. That language injected caution into expectations for further easing. Markets are adjusting their short term rate pricing accordingly.

    The immediate market reaction lifted the U.S. dollar, which is on track for roughly a 2 percent gain this month. A stronger dollar has several consequences. It tends to weigh on commodity prices in dollar terms and can tighten conditions for emerging market borrowers that have dollar-denominated liabilities. It also complicates policy messaging for the administration watching currency moves domestically. For the session ahead, dollar strength may cap gains in risk assets and keep a lid on currency sensitive sectors.

    Trade diplomacy and supply chain signals

    Trade headlines added to market momentum late in the week. A meeting between the U.S. president and his Chinese counterpart produced a pact that would reduce U.S. tariffs on Chinese goods and postpone curbs on Chinese rare earth exports. The meeting was described as unusually positive by one participant, and the agreement arrives just as markets are weighing geopolitical and commercial risks together.

    Short term, reduced tariffs can ease cost pressure for U.S. importers and support global trade activity. Over the longer term, the delay to rare earths curbs may slow moves by manufacturers to further diversify sourcing away from China. That matters for sectors reliant on specialized minerals and for countries in Europe and Asia that are trying to build alternative supply options. The deal echoes previous cycles of tentative trade détente that have provided temporary relief but left structural issues unresolved.

    Energy, sanctions and commodity dynamics

    Energy markets will be in focus as OPEC meets and is expected to announce another output increase. That decision could act as a moderating force on oil prices, but it also highlights the balancing act faced by Saudi Arabia. New U.S. oil sanctions on Russia have put Riyadh in a position where geopolitical and economic priorities pull in different directions. For traders, the key variables will be announced output levels and any commentary on coordination with other producers.

    Sanctions remain a live debate in terms of effectiveness. One columnist this week noted that their utility depends on how success is measured. That point feeds into market assessments of how sustained supply disruptions might be if sanctions expand or if countries find workarounds through reflagging or intermediary shipping networks.

    Metals are also notable. Copper hit a new all time nominal high on the London Metal Exchange at $11,200 per metric ton on Wednesday. That price action underscores sensitive demand dynamics in industrial metals and the link between manufacturing expectations and raw material costs. High copper prices can reflect short term squeezes, structural demand related to electrification and infrastructure, or policy shifts in large consumers.

    Regional policy pivots and market implications

    China’s policy moves in the electric vehicle sector are drawing attention. Recent commentary suggested that a policy pivot could reverse growth in EV output and exports. If production and exports slow, the impact will ripple across battery supply chains, regional vehicle makers and commodity flows tied to EV manufacturing. Asia markets will pay close attention to any official signals and data that confirm a broader slowdown in the sector.

    Meanwhile, analysts highlighted investigative reporting that links shipping activity to networks transporting sanctioned oil cargoes. That type of reporting can influence risk premia in tanker markets and shape expectations for enforcement and secondary sanctions. Markets will be sensitive to any follow up developments that affect shipping costs or insurance availability for certain routes.

    For traders and portfolio managers, the session ahead will combine headline driven volatility with underlying structural themes. Tech valuation concentration, Fed communication, U.S.-China trade measures, OPEC output plans and copper’s record price form a compact set of drivers that will shape risk appetite. Short term, futures strength suggests a positive open, but market participants will likely recalibrate positions as data and official commentary arrive. Over the medium term, the interaction between policy signals and corporate investment in AI, energy supply choices and industrial demand will be the axis around which markets adjust.

    Stay alert to intraday updates on central bank remarks, OPEC announcements and reponses in mega-cap tech stocks. Those will provide the clearest cues for how markets set direction in the next trading hours.

  • Tariff Shock: How New Duties Are Forcing Tech and Manufacturing to Reroute Supply Chains

    Tariff Shock: How New Duties Are Forcing Tech and Manufacturing to Reroute Supply Chains

    Tariffs are reshaping global supply chains and forcing corporate playbooks to change now. New duty threats and trade friction are pushing chipmakers, cloud providers and manufacturers to reroute production, accelerate regional partnerships, and reprice earnings forecasts. In the short term, this is weighing on China revenue and triggering volatility in semiconductors and e-commerce. Over the long term, it is accelerating supply-chain diversification to India, South Korea and onshore data-centre ecosystems. The story matters from Wall Street to Seoul: U.S. earnings, European industrial exposure and Asian manufacturing strategy are all being rewritten. Compared with past tariff episodes, companies today move faster — shifting contracts, striking sovereign AI deals and redesigning logistics in months, not years.

    Tariffs, geopolitics and the immediate market reaction

    Trade policy moves this autumn have compelled analysts and executives to reprice cross-border revenue exposure. NVIDIA (NASDAQ:NVDA) drew headlines when analysts said recent tariff rhetoric effectively “zeroed out” the notion of near-term China revenue growth in certain segments. That reaction matters now because NVDA is the market’s main conduit for AI demand, and its sales pattern influences chip supply chains globally.

    At the same time, big cloud and platform companies are racing to de-risk. Microsoft (NASDAQ:MSFT), Amazon (NASDAQ:AMZN) and Alphabet (NASDAQ:GOOGL) are expanding data-centre investments and local partnerships to shield customers from sudden trade frictions. Investors are watching guidance closely; when large-cap tech signals less China dependency, it often ripples through supply chains and part suppliers.

    How tech giants are rearranging manufacturing and partnerships

    Apple (NASDAQ:AAPL) remains a bellwether for hardware supply-chain moves. The company’s recent quarter showed resilient services and free-cash-flow strength, underlining operating flexibility even as manufacturers grapple with tariff uncertainty. That resilience matters now: manufacturers that can migrate assembly or diversify suppliers quickly will protect margins and holiday-season shipments.

    Meanwhile, NVIDIA’s major agreement with South Korea — a sovereign-scale AI infrastructure partnership involving local government, chip fabs and hyperscalers — is a real-time example of companies converting trade risk into regional industrial policy wins. Those pacted deployments accelerate local GPU demand and reduce reliance on single-country manufacturing loops.

    Amazon’s push on AI shopping assistants and Microsoft’s Azure momentum illustrate another angle: cloud demand can offset hardware revenue swings by boosting software and services receipts. Firms that blend device sales with cloud services can soften tariff shocks by shifting revenue mix.

    Regional plays: India, South Korea and a new map for supply chains

    Companies are not just talking about diversification — they are acting. South Korea’s sovereign AI deals and local chip investments aim to lock in capacity and data sovereignty. That reduces friction for firms needing onshore compute and mitigates tariff-related exposure.

    India is another obvious node. It offers scale, low-cost labor and investment incentives for electronics assembly. For global OEMs, moving labor-intensive final assembly to India shortens the path from policy shock to operational continuity. The near-term effect is logistical cost and retooling pain. The long-term effect is a more resilient, multi-hub manufacturing footprint.

    China will remain a critical part of global manufacturing. But firms increasingly hedge by layering India and Korea capacity into their networks. The net result: supply-chain complexity rises, and so do the premiums companies pay for agility.

    Sector watch — pockets of resilience and dividend stability

    Not all corporate pain is equal. Retail and services companies with dominant digital platforms can reallocate investment; cloud-exposed firms can offset hardware weakness. Industrials and aerospace are vulnerable to trade rules that affect parts and raw materials. Boeing (NYSE:BA), for example, sits in a complex web of international suppliers; any tariff escalation that hits aviation inputs would be watched closely by investors and regulators.

    Dividends offer a window on boardroom confidence. Advance Auto Parts (NYSE:AAP) recently affirmed its $0.25 dividend, signaling steadier cash flows in a parts distributor exposed to North American demand. Energy and mining names with predictable cash generation have taken similar stances, and those payouts can temper stock volatility while firms adapt to new trade regimes.

    What to watch next

    Trade-policy announcements and earnings guidance will be the immediate levers for sentiment. Watch semiconductors and cloud-provider commentary for signs of demand reallocation. Key datapoints include Q4 guidance from major chipmakers, disclosures of new sovereign or regional contracts, and incremental capital expenditure plans for local data centres and fabs.

    Regulatory developments — from customs enforcement to export controls — will shape the operational timeline. Companies that disclose concrete supply‑chain moves, regional contract wins or diversified vendor lists will reduce uncertainty. For markets, the lesson is clear: tariff shocks are accelerating strategic shifts that will rewire manufacturing and cloud geography in the next 12–36 months.

    Note: This article is informational and does not constitute investment advice.

  • Amazon.com Inc (AMZN): Earnings Fresh, Trade Engine Score Moderates Near New Highs

    Amazon.com Inc (AMZN): Earnings Fresh, Trade Engine Score Moderates Near New Highs

    Amazon.com Inc (NASDAQ:AMZN) stock has moved into focus after recent earnings and a mix of technical and fundamental signals. The company reported revenue just below estimates in its latest quarter, while analysts and news sentiment remain strongly positive. In the short term, price action reflects an earnings-driven re-rate and a modest breakout above the listed 52-week high; over the long term, Amazon’s strong profitability and growth scores support continued investor attention across the US, Europe and Asia. This matters now because earnings just landed and the stock’s divergence between technical momentum and fundamental strength is shaping near-term positioning.

    Introduction

    This report examines Amazon.com Inc (NASDAQ:AMZN) using market, fundamental and technical indicators available as of 2025-11-03. The goal is to give a multi-dimensional view: what the Trade Engine Score implies, how price has behaved around the latest earnings, how fundamentals stack up against sector norms, and what analysts and news flow are signaling.

    Key Takeaway: The Trade Engine Score

    Trade Engine Score: 63.41. This proprietary composite sits in the mid-range — neither a clear momentum buy nor a signal to avoid. The score reflects a split picture: strong fundamentals and elevated news/analyst sentiment versus weak technical breadth. Practically, the score suggests investors should weigh fundamental upside and analyst conviction against short-term technical caution.

    Recent Price Performance & Context

    AMZN closed at $244.22. Year-to-date the stock is up roughly $24 from $220.22 at the start of the year. The stated 52-week range lists a low of $161.38 and a high of $242.52; the latest close sits slightly above that high, signaling a near-term breakout relative to the provided range.

    Momentum indicators are mixed. The 50-day EMA (225.12) and 50-day SMA (226.62) sit well below the current price, indicating the recent trend has been upward. RSI at 43.82 is neutral-to-leaning-cool rather than overbought. The technical score (21.11) is low, implying short-term technical internals or breadth are weak despite higher moving averages — a divergence investors should note.

    Earnings Watch

    Amazon reported earnings on 2025-10-30. Reported revenue was $180,169,000,000 versus an estimate of $181,289,925,175 — a small miss of roughly 0.6%. The company had both an earnings event in the past 7 days and a scheduled earnings calendar entry, so near-term volatility around the print is expected to dominate trading flows.

    Key implications: a slight revenue shortfall can pressure near-term price action, but the impact depends on segment detail (e.g., AWS growth, e-commerce margins) and management commentary. Earnings quality carries a letter grade of A- with a score of 64.74, which indicates reported results are reasonably robust from an accounting-quality perspective.

    Sector Comparison

    On sector metrics, the Consumer Discretionary/related benchmark shows a PE (TTM) around 15.6 and quarter-on-quarter revenue growth at roughly 0.27%. Amazon’s composite fundamental indicators (high profitability and growth scores) suggest it sits comfortably above typical sector peers on business quality and expansion metrics. Where Amazon diverges is in net margin reporting (listed here as 0.00%), which likely reflects rounding or specific accounting period effects; nonetheless, profitability diagnostics flag strong operating performance.

    Fundamental & Technical Analysis

    Fundamental strengths are clear: a fundamental score of 74.10, a profitability metric at 100.00%, and a growth score of 72.58 underscore durable business economics and reinvestment capacity. Capital allocation sits at 32.79% and leverage at 53.59%, indicating moderate debt usage coupled with active allocation decisions.

    Technically, the picture is mixed. The low technical score (21.11) contrasts with moving-average support and a neutral RSI. That suggests trend-following signals are positive (price above 50-day averages), but broader technical health (momentum breadth, short-term oscillators) is lagging. Traders will want to watch intraday volume and short-term momentum to confirm any breakout above recent highs.

    Analyst Sentiment

    Analyst sentiment registers very high: an analyst score of 100.00 based on 75 analysts. The mean target sits at $272.31 and median at $270.30, implying roughly 11–12% upside from the current close. The distribution of ratings is heavily skewed toward Buy/Strong Buy relative to Sell, reinforcing a bullish consensus despite the recent revenue miss.

    The target range spans from $229.37 to $321.30, which highlights differing views on upside potential tied to AWS growth, ad revenue cadence and margin leverage over time.

    Synthesising News

    News coverage for AMZN on 2025-11-03 was light; the available headlines that day focused on an unrelated company. Despite that, Amazon’s proprietary news sentiment score is high at 91.00, indicating that when the company is covered the tone tends to be favorable. That elevated sentiment supports analyst bullishness and helps explain why the Trade Engine Score is mid-range even with weak technical internals.

    Conclusion

    Amazon’s recent earnings print produced a small revenue miss, but the broader picture remains supportive: strong fundamental scores, high analyst conviction and positive news sentiment. The Trade Engine Score (63.41) sits in neutral-to-moderate territory because strong fundamentals and sentiment are offset by weak technical internals. Price action marginally above the stated 52-week high points to renewed investor interest, while the neutral RSI and low technical score counsel attention to short-term momentum before assuming a sustained uptrend.

    For investors and analysts, the relevant takeaways are clear: fundamentals and analyst targets suggest upside potential; short-term traders should respect technical signals and earnings-driven volatility; and any assessment should incorporate segment-level results and management commentary from the recent report. This synthesis provides a multi-angle picture without issuing explicit buy or sell guidance.

  • Amazon Web Services Posts 20% Q3 Sales Growth, Driving AI-Fueled Rally

    Amazon Web Services Posts 20% Q3 Sales Growth, Driving AI-Fueled Rally

    Amazon Web Services posts 20% third-quarter sales growth, driving a fresh AI-fueled rally and putting pressure on Federal Reserve timing for another rate cut. The strength matters now because it confirms AI is powering the market’s advance in the near term and could alter capital flows over the long term. In the US, it keeps mega-cap leaders in focus; in Europe and Asia, it raises questions about who can compete on infrastructure spend; in emerging markets, it highlights uneven access to high-performance compute. Compared with previous tech cycles, spending on AI now outpaced consumer spending in recent GDP data, making this a timely market test.

    The market’s broad trajectory shifted when Federal Reserve chair Jerome Powell said the central bank is unsure about a third rate reduction in December. Stocks reacted, but not dramatically. The S&P 500 fell less than 0.5% on the day. Still, Powell’s comment cut through a narrative that lower rates are a prerequisite for a sustained broad market advance.

    AI has powered most of the rally. Amazon Web Services (NASDAQ:AMZN) reporting 20% sales growth in Q3 reinforced that theme. Investors pushed shares higher after hours, signaling confidence that cloud demand and AI workloads are real revenue drivers. The immediate effect is to keep heavyweights at the center of flows. The Magnificent 7 ETF closed up on the day, while cyclical names and small caps slumped.

    That divergence matters for short-term market breadth. If AI leaders keep outperforming, the rally can persist even without further Fed easing. However, a broader market advance that would make the rally healthier still likely needs lower rates to help economically sensitive companies catch up. Investors are watching who benefits from easier policy and who remains rate-sensitive.

    Sam Zief, global macro strategist at JPMorgan Private Bank (NYSE:JPM), said investors want the Fed to cut more for cyclical recovery, not because the market strictly needs it. “I don’t necessarily think that the market needs the Fed to cut, I think the economy would like the Fed to cut,” he said. Powell also suggested the AI trade is not rate sensitive, underlining how central bankers differentiate between market concentration and broader financial conditions.

    One underappreciated link between AI and macro is capital intensity. AI capital expenditures rose faster than consumer spending in the latest GDP release. That means a shock that threatens AI spending could tighten financial conditions more broadly. Investors are watching corporate balance sheets for that reason.

    Wall Street is increasingly focused on how companies finance AI investments. Meta Platforms (NASDAQ:META) fell about 11% after reporting strong results but signaling increased capital expenditures. The drop shows how investors may balk at open-ended spending funded by debt if returns remain uncertain.

    Not all AI-related borrowing is equal. Gil Luria, managing director at D.A. Davidson, pointed to Microsoft (NASDAQ:MSFT) as an example of a firm whose deep balance sheet and management track record make higher capex a bullish sign. Firms with weaker demand outlooks or thin credit profiles are more exposed if they lean on debt to build capacity prematurely.

    Oracle (NYSE:ORCL) stands out in recent estimates. Morgan Stanley projects Oracle’s debt could double to more than $290 billion by fiscal 2028. That level raises questions about overbuild risk and whether equity financing would be preferable. Smaller cloud infrastructure players such as CoreWeave and Crusoe are also reinvesting heavily to keep pace with each new generation of chips, creating a cycle where every hardware refresh pushes up costs.

    If you believe the AI buildout will generate sustained productivity and revenue gains, debt-financed expansion can make sense. Big companies prefer not to load up too much leverage because it can sour investor sentiment and affect credit ratings. Still, the pace and opacity of some financing — including off-balance-sheet arrangements — make oversight harder for investors and regulators.

    Luria warned that if debt levels surge and demand disappoints, the fallout could create systemic stress. He compared the risk profile to past credit crises, noting that speculative overbuild financed through leverage can amplify downturns. Policymakers and market participants will therefore watch leverage metrics closely in the coming quarters.

    Market participants are parsing which groups will benefit from lower rates, should they arrive, and which will not. Cyclicals and smaller companies that carry more debt tend to be more rate-sensitive. In contrast, large AI leaders with robust cash flows show resilience to tighter policy, at least in the near term.

    Bitcoin’s October performance offered another data point about market structure. After six consecutive Octobers of gains — a pattern some traders nicknamed “Uptober” — Bitcoin fell about 7.2% in October. The cryptocurrency started the month around $118,500 on CoinGecko and traded near $110,000 by early November.

    That decline reflected a combination of factors. Institutional flows tied to spot ETFs have changed market behavior since 2024. Political developments, such as President Trump’s trade rhetoric toward China, removed some cross-border optimism. Fed remarks that failed to provide a clear catalyst also knocked prices; Bitcoin fell roughly 3.5% the day after tepid Fed commentary.

    Still, Bitcoin has shown extreme moves within the month, including a peak above $125,000 earlier. The episode underscores how a younger asset class behaves differently now that institutional participation is larger. Traditions that once guided retail-driven cycles no longer map cleanly to a market with ETFs and institutional algos.

    Looking ahead, the key things to watch are clear. First, the Fed’s timing and communication about rate cuts. Second, corporate debt loads at firms funding AI expansion. Third, whether AI spending converts into productivity and top-line growth at scale. Finally, market breadth: whether gains widen beyond mega-cap leaders into cyclical and small-cap groups.

    For investors and observers, the next several quarters will test the durability of an AI-led rally. Companies with deep balance sheets and disciplined capital allocation may justify higher investment. Others that take on large amounts of debt to chase market share could face harder questions if revenue lags expectations.

    Separately, retail-finance firms continue to rework offerings to serve AI-driven commerce. Synchrony Financial (NYSE:SYF) and others are positioning for agentic shopping and payments that integrate with AI agents, a development that could reshape how brands surface products to consumers over time.

    Markets are thus balancing two competing narratives. One is that AI is a structural growth driver powerful enough to sustain valuations. The other is that rapid, debt-fueled expansion raises financial risks if demand fails to meet elevated spending. In the short run, strong quarterly prints like AWS’s 20% sales growth will keep capital focused on AI leaders. Over the long run, capital allocation choices and the Fed’s policy path will determine whether that concentration gives way to broader market participation.

  • Eli Lilly (NYSE:LLY) Near 52-Week High After Earnings Beat; Trade Engine Score Elevated

    Eli Lilly (NYSE:LLY) Near 52-Week High After Earnings Beat; Trade Engine Score Elevated

    NYSE:LLY posted an earnings beat and is trading near its 52-week high, pushing momentum across global and domestic investors. Short-term, the stock is reacting to a revenue beat and strong news sentiment that supports near-term upside. Longer-term, elevated growth and profitability scores point to durable fundamentals amid rising GLP-1 competition from peers. This matters now because recent earnings and a flurry of industry M&A dynamics are reshaping competitive positioning in the profitable weight-loss and diabetes markets across the US, Europe and emerging markets.

    Introduction

    This report focuses on NYSE:LLY, the health-care giant. The objective is to provide a multi-dimensional view using the latest price, technical, fundamental, analyst and news metrics. The goal: clarify what recent data implies for investors without making explicit buy or sell calls.

    Trade Engine Score: What the 72.42 Reading Means

    The proprietary Trade Engine Score for NYSE:LLY sits at 72.42. That score blends technical, fundamental, sentiment and analyst inputs into a single gauge. A score in the low 70s typically signals constructive momentum with meaningful fundamental support, rather than a frothy, momentum-only trade.

    Practically, the score suggests that recent positive catalysts—earnings and news sentiment—are being validated by analysts and market flows. However, it is not an extreme reading that eliminates pullback risk.

    Recent Price Performance & Context

    LLY closed at $862.86. The stock is trading about 7.8% below its 52-week high of $935.63, putting it within striking distance of the top of its range. The 52-week low is $623.78.

    Momentum indicators are strong: RSI is 71.27, which signals near-term overbought conditions but also confirms bullish momentum. The 50-day EMA ($758.50) and 50-day SMA ($736.29) both sit well below the current price, showing a clear upward trend over the medium term.

    Earnings Watch (Recent Beat and Near-Term Calendar)

    LLY reported earnings on 2025-10-30 and had earnings scheduled in the same window. Revenue came in at $17,600,800,000 versus estimates of $16,197,759,759 — a beat of roughly $1.40 billion, or about +8.7% versus consensus.

    That top-line surprise is timely. In the short term, earnings beats can compress uncertainty and lift analyst confidence; in the medium term, the market will look for margin and guidance signals tied to product launches and pricing dynamics in GLP-1 treatments.

    Sector Comparison

    Sector benchmarks show a PE (TTM) of 14.18 and sector revenue growth (QoQ YoY) of 4.78%. The sector payout ratio (TTM) is roughly 38.44%.

    By contrast, LLY exhibits strong internal scores for growth and profitability (see below), implying company-level dynamics may outpace the broader health-care sector. The stock trading near its 52-week high alongside an earnings beat suggests relative outperformance versus sector averages in the recent quarter.

    Fundamental & Technical Analysis

    Fundamentally, the company posts a fundamental_score of 74.10 and an earnings quality score of 60.62 (graded A-). Sub-scores show capital allocation at 37.66%, growth at 76.86% and profitability at 71.56%. Those readings point to above-average growth and solid profitability, with moderate capital-allocation discipline.

    Technically, the technical_score is 43.92, which is middling and contrasts with the bullish price action and elevated RSI. The divergence—strong fundamentals and price momentum, but a middling technical score—suggests breadth or other technical filters are dampening a pure technical endorsement. High RSI flags potential short-term pullbacks, while the 50-day EMA/SMA confirms a bullish trend.

    Analyst Sentiment

    Analyst coverage — summarized by a 100.00 analyst score (32 listed analysts) — skews strongly positive. The mean target price is $926.82 and the median target is $918.00, implying roughly 7.4% and 6.4% upside versus the $862.86 close.

    Consensus ranges from a low of $661.20 to a high of $1,249.50. Aggregated ratings provided show a preponderance of buy and strong-buy views and very few sell opinions, reinforcing broad analyst confidence in the company’s outlook.

    Synthesising News

    News flow on 2025-11-03 included an item on peer NYSE:NVO making a surprise bid in the weight-loss space. That development underscores an active consolidation and competitive push in GLP-1 and obesity therapeutics.

    For LLY, heightened M&A and competitive bids across the sector increase strategic pressure but also validate market economics in the category. News sentiment for LLY registered highly positive readings, which, combined with the earnings beat, helps explain the near-term price strength and the elevated Trade Engine Score.

    Conclusion

    LLY presents a mixed-but-favorable picture: strong fundamental scores, an earnings-driven revenue beat, and elevated analyst targets are supporting price strength. The Trade Engine Score of 72.42 synthesizes those positives into a constructive but not extreme signal.

    Technical indicators (RSI and moving averages) confirm momentum but warn of near-term overbought conditions. Meanwhile, industry developments—especially peer M&A and competition in weight-loss drugs—remain a live strategic variable. Overall, the stock looks fundamentally solid with momentum that merits attention, while investors should watch for pullbacks and further company guidance as the next confirmatory data point.

  • Earnings Beats and Technical Heat Put CAT, LLY and UNH in the Spotlight

    Earnings Beats and Technical Heat Put CAT, LLY and UNH in the Spotlight

    Caterpillar (NYSE:CAT), Eli Lilly (NYSE:LLY) and UnitedHealth (NYSE:UNH) are center stage after a busy week of results and sector headlines. CAT reported a revenue beat and extended its rally, sending technical indicators into overbought territory. LLY posted stronger-than-expected top-line figures while Novo Nordisk’s takeover moves sharpen competitive focus in weight-loss medicine. UNH’s report showed revenue slightly shy of estimates and highlighted rising cost pressure across U.S. health insurers. Short term, markets are reacting to earnings and headlines. Long term, dynamics like capital allocation, margin sustainability and regulatory developments in equipment repair and healthcare policy will matter for returns across North America, Europe and emerging markets.

    Caterpillar (NYSE:CAT) — Earnings beat, technicals stretched

    Caterpillar closed at $577.26 after reporting revenue of $17,638,000,000 versus estimates of $16,940,679,500. That beat reinforced the recent run: CAT’s 50-day EMA is 444.23 and its 50-day SMA is 437.27, while the RSI sits at 82.25 — a level that signals overbought conditions. The stock’s 52-week range is $267.30–$596.21, showing strong recovery year-to-date from the $359.77 start-of-year reference.

    Technical measures are mixed against fundamentals. CAT posts a technical score of 98.91 but a fundamental score of 44.53. Analysts (27 tracked) show a wide spread of views: mean price target $499.54, median $490.11, range $353.50 to $682.50. The company’s capital allocation is 45.72%, growth 71.14% and profitability marked at 100.00% in the dataset; leverage reads 40.63%.

    Why this matters now: the earnings beat supports momentum, but elevated RSI and heavy analyst dispersion raise the chance of short-term consolidation. Broader industry policy noise — including right-to-repair debate for farm equipment — could reshape aftermarket service economics for heavy-equipment OEMs and dealers, particularly in agricultural end markets.

    Eli Lilly (NYSE:LLY) — Strong top-line, competitive pressure intensifies

    Eli Lilly closed at $862.86 after reporting revenue of $17,600,800,000 versus estimates of $16,197,759,759. The stock’s RSI is 71.27, near overbought territory, with a 50-day EMA of 758.50 and SMA of 736.29. Over the past year LLY traded between $623.78 and $935.63, and year-to-date gains have been notable.

    Analyst sentiment is uniformly bullish: an analyst score of 100.00 based on 32 analysts, with mean price target $926.82 and median $918.00. Fundamental metrics show a 74.10 score; capital allocation 37.66%, growth 76.86%, profitability 71.56% and leverage 56.39%. Newsflow adds pressure: Novo Nordisk’s surprise bid for Metsera is intensifying M&A and competitive dynamics in the weight-loss category, where LLY is an active participant.

    Why this matters now: LLY’s beat fuels positive sentiment and high analyst conviction, but intensified competition and high valuations (RSI >70) make subsequent guidance and pipeline updates key short-term focus points for investors monitoring global pharma exposure.

    UnitedHealth (NYSE:UNH) — Profitability strong, cost pressures visible

    UnitedHealth closed at $341.56. The company reported revenue of $113,161,000,000 versus estimates of $114,194,805,357, a slight miss that coincides with industry commentary about rising healthcare costs. UNH’s RSI registers at 72.26, with the 50-day EMA at 320.79 and SMA at 307.26. The 52-week range spans $234.60 to $630.73.

    UNH’s fundamental score is high at 81.98 and technical score is 60.79. Analysts (28 tracked) carry a mean price target of $376.26 and a median of $405.45, with recommendations heavily skewed to buy. Company metrics show capital allocation at 55.94%, growth 79.94%, profitability 100.00% and leverage 51.27%.

    Why this matters now: the insurer group faces near-term headwinds from medical cost trends and political uncertainty cited in recent coverage. For investors, the immediate reaction to Q3 results centers on margin trajectory and reserve assumptions that will shape guidance for the next quarters.

    What to watch next — catalysts, risks and evidence

    Key near-term catalysts: post-earnings commentary, updated guidance from management teams, and any regulatory moves on equipment repair or healthcare policy. For CAT, watch dealer inventories, backlog and margin commentary tied to construction and agricultural demand. For LLY, closely track competitive moves in obesity and diabetes treatments and R&D pipeline updates. For UNH, monitor medical cost trends, reserve changes and Medicare Advantage enrollment signals.

    Market signals to monitor: high RSI readings across CAT, LLY and UNH suggest stretched positioning and raise the probability of short-lived pullbacks. Contrast technical momentum with each company’s fundamental score and capital allocation priorities. Analyst price-target dispersion, especially for CAT, reflects a broad range of scenarios investors should parse alongside management commentary.

    Final read: earnings and headlines have prompted fresh attention across industrials and healthcare. Short-term price action will follow guidance and sector-specific developments. Over the longer term, profitability, allocation decisions and regulatory forces will determine which of these high-profile names sustain gains across the U.S., Europe and emerging markets.

  • Nvidia (NVDA) Nears 52-Week High After South Korea AI Pact; Trade Engine Score Strong

    Nvidia (NVDA) Nears 52-Week High After South Korea AI Pact; Trade Engine Score Strong

    Nvidia is in the spotlight after a major South Korea AI partnership that will deploy 260,000 GPUs nationwide, accelerating hardware demand and cementing Asia as a focal point for large-scale AI infrastructure. This matters now because the deal gives Nvidia clearer near-term revenue visibility and reinforces multi-year secular growth in datacenter GPUs. Short-term: order visibility, share-price momentum, and analyst attention. Long-term: expanded addressable market in Asia, deeper enterprise relationships, and stronger recurring demand. Globally, the pact tightens Nvidia’s lead in the US and Europe while reshaping capacity planning in Asia and emerging markets.

    Introduction

    This note analyzes NVDA (NASDAQ:NVDA) using the latest technical and fundamental snapshots, analyst consensus, and recent news flow. Objective: provide a multi-dimensional view that explains current price action, the role of the Trade Engine Score, and how recent earnings and the South Korea partnership interact with longer-term growth drivers.

    Key Takeaway: The Trade Engine Score

    The proprietary Trade Engine Score (81.91) sits in a high range. The score blends technical strength, fundamentals, sentiment, and analyst input. At ~82, it implies a bullish posture driven by robust technicals, top-tier fundamentals, and very favorable market sentiment. Investors typically treat a score at this level as momentum- and sentiment-backed — evidence of both trend and breadth in support — but not a guarantee of immediate upside.

    Recent Price Performance & Context

    Shares closed at $202.49, up roughly $64.18 year-to-date from the $138.31 start-of-year level. The stock is trading within about 5% of its 52-week high of $212.19 and well above the 52-week low of $86.62, signaling renewed upside momentum.

    Technical indicators reinforce that momentum: a 50-day EMA of 177.11 and a 50-day SMA of 178.07 lie below the current price, while an RSI of 63.19 shows strength without extended overbought readings. The technical score of 88.44 further supports a trend-consensus bullish view.

    Earnings Watch

    Nvidia reported recent quarterly results with reported revenue of $46.743 billion versus consensus estimates of $46.979 billion — a modest miss of roughly $236 million (about 0.5%). The company’s earnings cadence remains central to market moves because guidance and datacenter orders can materially affect forward estimates given the concentrated revenue mix.

    Given the timing and the South Korea announcement, investors will be watching management commentary for deployment timelines, contract structure (capex vs. recurring services), and supply-chain implications that could affect near-term revenue recognition and margin dynamics.

    Sector Comparison

    Compared with its sector, Nvidia remains a high-growth outlier. The sector PE (TTM) sits near 23.16 and quarterly revenue growth (YoY) around 4.39% — both markedly lower than Nvidia’s growth profile. Nvidia’s growth score is 100.00 and profitability is 100.00, indicating the company operates above typical sector benchmarks on these axes.

    Sector payout (TTM) is about 35.5%, but Nvidia’s capital allocation (65.02%) and leverage (26.53%) suggest disciplined reinvestment and modest balance-sheet leverage versus the broader technology cohort.

    Fundamental & Technical Analysis

    Fundamentally, Nvidia shows strength across growth and profitability metrics, and an earnings quality score of 72.89 with a letter grade of “A” validates the quality of reported results. Capital allocation at 65% suggests meaningful reinvestment in R&D, M&A, and infrastructure support for AI platforms.

    Technically, the 50-day moving averages below the price and a high technical score (88.44) point to a clear upward trend. RSI near 63 signals room to run before classic overbought thresholds. Together, these signals indicate bullish trend confirmation underpinned by strong fundamentals.

    Analyst Sentiment

    Analyst sentiment is strongly positive. The aggregate analyst score is 100.00 based on inputs attributed to 60 analysts. The mean target price is $225.37 and the median is $220.83, implying ~11% and ~9% upside, respectively, from the current close of $202.49.

    • Total indications in the dataset show a heavy skew toward buy-side language (1,485 strong buy; 2,817 buy) with a smaller group on hold or sell (1,034 hold; 104 sell; 32 strong sell), reflecting broad bullish conviction but a non-trivial diversity of views.
    • Target range is wide (low $101 to high $409.22), illustrating differing time horizons and scenario assumptions among analysts.

    Synthesising News

    The South Korea partnership to deploy 260,000 GPUs with the government and major conglomerates (Samsung, SK Group, Hyundai, LG, NAVER) is the single most material news item. It provides both order visibility and a strategic foothold in a priority market.

    News sentiment is highly positive (score 96.00), aligning with analyst optimism and supporting the Trade Engine Score. The deal strengthens long-term TAM arguments and should reduce execution uncertainty in Asia. In the near term, markets will parse timing and revenue recognition mechanics; in the medium term, the partnership points to accelerating recurring demand for datacenter ecosystems.

    Conclusion

    NVDA (NASDAQ:NVDA) sits at the intersection of strong fundamentals, vigorous technical momentum, and very positive market sentiment. The Trade Engine Score (~81.91) reflects that confluence. Recent earnings showed stable top-line scale with a slight revenue miss, but the South Korea GPU pact materially improves order visibility and strategic positioning in Asia. Analyst targets imply modest upside from here, although the wide target range highlights divergent timeframes and scenario expectations. Overall, Nvidia’s setup remains growth-driven and sentiment-favored — important context for investors monitoring earnings commentary and contract timelines.